Future Trader is constructed with a number of panels which are explained in this section.
Toolbar

Use the settings toolbar to customize your platform layout, access reports and the online help manuals and other useful resources. Other functions include currency selection (live or simulated) and log out.
Product Navigator
Use the Product Navigator to find the right product to trade. Find out what the newest products are and what’s popular with other clients. Three tabs make up the Product Navigator:
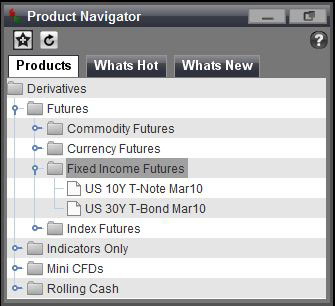
- Products: View the hundreds of products in the various asset groups that GT247.com offers. By clicking the sign the subgroups belonging to each asset class are displayed. Within each subgroup the specific products can be seen.
- What’s New: Any new products added to GT247.com’s product offering will be displayed here.
- What’s Hot: GT247.com’s ten most popular products are listed here. Ratings are based on trade volumes and unique GT247.com technical indicators:
Rating:
| Rating |
Indicator |
| < 2% |
 |
| >=2% and < 4% |
 |
| > =4% and < 6% |
 |
| >= 6% and < 8% |
 |
| >= 8% |
 |
Each of the top ten products is rated according to the percentage of trades placed for that particular product.
Bull / Bear:
A real-time technical indicator which displays GT247.com’s client sentiment displays the relationship between bullish (buy) and bearish (sell) traders for each product.
(Bull Bear Ratio = Total Buy Trades/ (Total Buy Trades + Total Sell Trades) X 100)
| Bull Bear Ratio |
Description |
Image |
| <=19% |
Extremely Bearish |
 |
| >=20% and <40% |
Moderately Bearish |
 |
| >=40% and <60% |
Neutral |
 |
| >=60% and <80% |
Moderately Bullish |
 |
| >=80% |
Extremely Bullish |
 |
Volatility:
A weekly indicator showing the variance of the product’s 30 day volatility from the average 30 day volatility of all Futures offered by GT247.com.
| Relativity to Average Product Price |
Description |
Image |
| <-10% |
Instrument volatility is negatively less than the average volatility.
|
 |
| >= -10% and <= 10% |
Instrument volatility is similar to the average volatility. |
 |
| >10% |
Instrument volatility is positively greater than the average volatility. |
 |
Watchlists
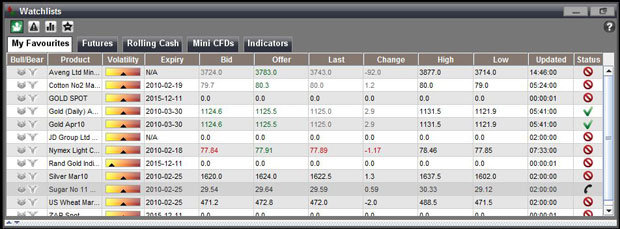
Watchlists are designed to provide easy access to products of interest. You can create up to five watchlists to store any products you wish.
Quick Trade Ticket
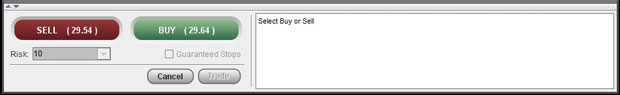
The Quick Trade ticket streamlines trading one specific product at a time. This ticket is geared towards the trader who is in and out of the market multiple times a day. After selecting a product, a trade can be opened with a mere 3 clicks at the price you want.
Open Transactions
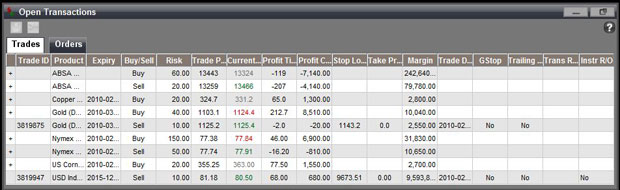
The Open Transactions Window consists of 2 tabs:
1. Trades
Each time you place a successful trade, it will be added to the Trades tab. All positions reflect real time profit/ loss and current market values.
2. Orders
The Orders tab lists all the orders you have placed that have not yet been opened as trades. An Order is an instruction to buy or sell the specified product if the price hits your stated level. The Orders tab shares many of the same columns with the Trades tab.
Information displayed risk management tools applied as well the type of order taken.
Account Balance Panel

The Account Balance Panel allows real-time monitoring of your account balance. Your account information is constantly displayed across the top of the platform.
| Nett Asset Value |
The Nett asset value of your account (aggregate of Free Cash + Profit/Loss of on Open Positions + Margin Requirement) |
| Free Cash |
This shows your funds available for entering into additional positions |
| Margin Account |
This is the total margin requirement to support your open positions |
| Profit/Loss to Date |
Total profit/ loss accumulated on a particular account to date |
| Profit/Loss on Open ositions |
The current market value of open positions |
| Trading Currency |
The currency you are trading in |
Favourites Ticker
The Favourites Ticker is a scrolling ticker of the products stored in your watchlists. The scrolling speed and the view (Product image or product High/Low) can be modified to you preferen

Information
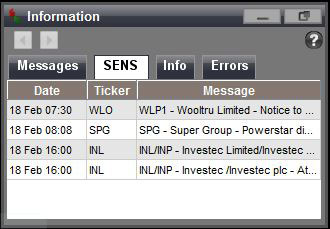
An easy to access inbox where you can view SENS announcements, trade & order confirmations, platform/ data feed errors and retrieve messages sent to you from GT247.com.
Status Panel

The Status panel gives you snapshot of your platform’s performance
1. Price Updates

Mouse over the Reuters symbol to obtain the last price update. The shading of the Reuters symbol is an indication of the last time a price update was received.
| Delay |
Image |
| in the last second |
 |
| 1 second ago |
 |
| 2 seconds ago |
 |
| 3 seconds ago |
 |
| 4 seconds ago |
 |
| 5 seconds ago |
 |
| 6 seconds ago |
 |
| 7 seconds ago |
 |
2.Connection Speed
Monitor your platform’s connections by using the Connectivity indicator. For an optimal trading experience, ensure that your connection speed remains between 0.000 and 1.000 seconds.
| Connection Speed |
Image |
| 0.000 to 0.100 seconds |
 |
| 0.101 to 0.500 seconds |
 |
| 0.501 to 1.000 seconds |
 |
| 1.001 to 1.500 seconds |
 |
| 1.501 + seconds |
 |
| Connection Error |
 |
3.Action
To ensure that you always know happening in the background, the current action that your platform is performing is always displayed
|